Welcome to Sino Bearings web
24x7 HOTLINE:+86-28-81454188

 TECHNOLOGY
Using Spectrum Analysis of Recorded Ultrasounds
Adrian Messer, CMRP
Manager of US Operations
UE Systems
Airborne & Structure-borne ultrasound instruments have become a perfect complement to infrared and vibration analysis tools. Ultrasound can no longer be considered just a leak detector, and most would consider ultrasound a must have technology for any maintenance & reliability program. Advancements in instrumentation and software have allowed the users of these instruments the ability to accurately diagnosis bearing faults, pump cavitation, and valves. This paper will discuss how using the concept of ultrasound imaging, one can diagnose mechanical failures in rotating equipment.
For mechanical inspection, vibration analysis has been the conventional method of inspection for condition monitoring of rotating equipment. Vibration analysis produces a visual spectrum or time wave form that shows any fault harmonics. If the goal is to have a truly world class predictive maintenance program, the use of multiple technologies is recommended for various inspections. Just as a physician uses multiple tools to take vitals and diagnostics to determine aches, pains, and abnormalities, maintenance professionals should take the same approach when it comes to the assets that we are responsible for in our facilities.
In addition to using vibration, ultrasound can be used to complement other PdM technologies. Airborne and structure-borne ultrasound can also give the user an “image” to analyze to diagnose and confirm mechanical conditions. Ultrasound technology and instrumentation has evolved into a must have technology for condition monitoring. The concept of ultrasound imaging is to record ultrasounds heard via the ultrasound instrument, and then play back those recorded sounds in spectrum analysis software. This will provide the inspector with the audible sound heard in the field during the inspection and a visual “image” or spectrum of the recorded ultrasound. This method will help to reduce the subjectivity of only relying in changes in the decibel level and changes in the sound tone or quality heard by the inspector.
Mechanical Inspection
Reciprocating compressor valves are very noisy and produce a lot of extraneous vibration. By isolating the sound with the advantage of the short-wave nature of ultrasound, it is possible to listen to and view the sounds of these noisy valves in real time, and to determine when a valve is leaking by. How would you imagine the sound of a “good” compressor valve? As it opens and closes, there will be a definite pronounced clicking. What about a bad valve? Below are two examples of recorded ultrasounds of reciprocating compressor valves and then viewed in the time series in spectrum analysis software.

The example labled as good has a very distinct and short time when the valve is open, and then the valve closes quickly. The bad compressor valve has a much longer time period when it is open before closing.
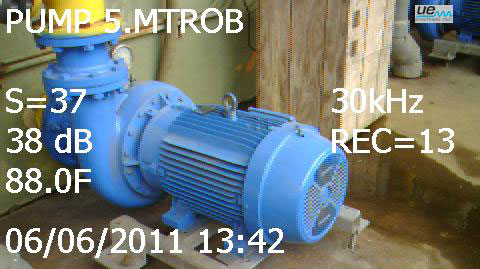
Another example below is from a motor and pump combination. The motor was a 60hp powering a pump that was pumping water. The image below was taken while the data was collected. This will be a comparison between two of the eight total motor and pumps.
While collecting data, both decibel readings and sound files were recorded. The screen shots below show a comparison between the points “PUMP 3 MTROB 007” and the “PUMP 4 MTROB 010.” The images are FFT images from spectrum analysis software that plays back recorded ultrasound sound files. This software is available with ultrasound instruments that have onboard sound recording capability.


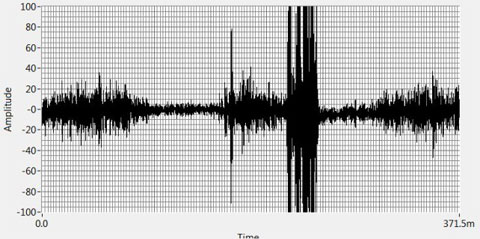
Notice the difference between the two points. Both motors are operating under the same conditions, but the Pump 4 MTR OB point has a much different spectrum. If you were listening through the headset of the ultrasound instrument, it would also have a much different sound. Another image of the Pump 4 MTROB point, captured from onboard the ultrasound instrument, can be seen below.

The spectrum analysis software used has a built-in bearing fault frequency calculator. By entering in the speed (rpm) and the number of balls (bearings), an outer race, inner race, ball pass, and cage frequency will be calculated. For this particular motor, the speed was 1750rpm and the type and number of bearings was confirmed and the number of bearings was 10. The fault frequency calculated by the spectrum analysis software that was of interest was an inner race fault at 175Hz. This is the same fault harmonic detected on the ultrasound instrument.
As individuals responsible for the condition and reliability of the assets in our facilities, we should want to use as many tools as we can to inspect those assets. Through the proper use of multiple PdM tools, the data that we collect with those tools can give us better results, and more potential failures can be detected. The concept of ultrasound imaging or recording and analyzing ultrasounds via an ultrasound instrument is fairly new when compared to other technologies. However, the use of ultrasound for mechanical inspections is growing. The spectrum analysis of recorded ultrasounds can enhance diagnostic accuracy, and reduce the subjectivity of only comparing decibel readings and changes in the tone of the sound heard by the inspector.
For more information, consult UE Systems website for Ultrasound applications in Bearing Inspection & Lubrication.