 TECHNOLOGY
 PRODUCTS
(2)
where ξ is the damping ratio, k is the meshing stiffness, Jp and Jg are the mass moments of inertia of the pinion and gear, and rp and rg are the base circle radii of the pinion and gear, respectively.
The damping model of bearings in KISSsoft is based on the inclusion of separate viscous damping in translational and rotational directions. In this study, the same damping coefficients are used for all bearings. Typical values for the translational directions, Cux=Cuy=Cuz=10 Ns/m, and for the rotational directions, Crx=Cry=Crz=1 Nms/rad. A higher amount of damping will considerably dampen the vibrations and will lead to an unrealistic response of the system. Therefore, the selection of damping coefficients must be carried out with care.
Dynamic Factor
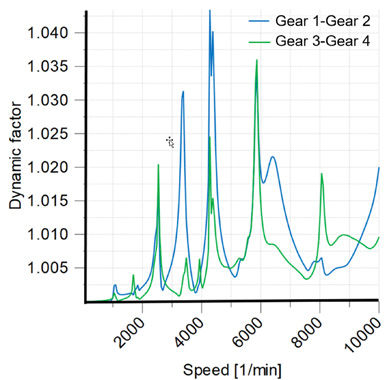
In the first step of the forced response analysis, the undamped response of the gearbox model to the first harmonics of the gear meshes’ excitations under nominal input torque equal to 320 Nm is studied. The goal of this investigation is to check how the eigenmodes of the system contribute to the dynamic gear mesh forces. For this purpose, the speed range of the input shaft is considered from 100 to 10,000 rpm at 200 evenly spaced speeds. After running the forced response, the variation of the dynamic factor as a result of this analysis is shown in Figure 4.
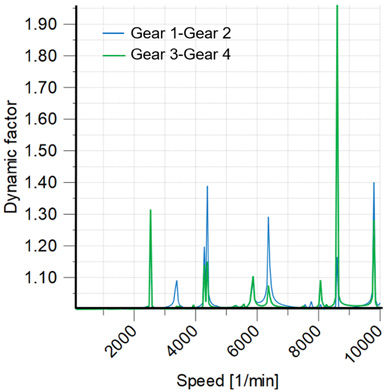
At several speeds, the peak values of the dynamic factor are obvious. These points are associated with the excitation frequencies which are close to one of the eigenfrequencies governed by the gear pairs, see Table 4. For instance, this can be seen especially at S = 8,543.43 rpm, which is in fact the eigenmode No. 17. It is important to notice that two gear pairs have different gear mesh excitation frequencies. Furthermore, the influence level of the eigenfrequencies and their corresponding eigenmodes on the relative movement of the meshing contact points of two gear pairs can be significantly different. Therefore, special attention needs to be paid to finding the relation between the eigenfrequencies and the input-shaft speeds at which a peak value of the dynamic factor is observed. It is important to note that Figure 4 illustrates a qualitative variation of the dynamic factor rather than providing a quantitative representation. This implies that selecting different input parameter settings can lead to varying peak values of the dynamic factor. However, this is entirely reasonable, as the speeds at which these peak values occur remain consistent. This consistency arises because the system’s response and, consequently, the maximum dynamic contact force are significantly influenced by the excitation frequencies.
Effect of Damping
In this section, the effect of damping in shafts, gear meshes, and bearings is separately investigated to provide more insight into to their individual effect on the reduction of the meshing contact forces and the bearing reaction forces. The investigation is carried out at the input torque 320 Nm for a wide range of running speeds and damping values. The analysis is followed by considering the case when the effect of damping in all elements is combined.
Damping in Shafts
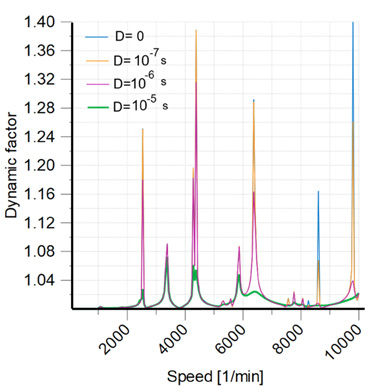
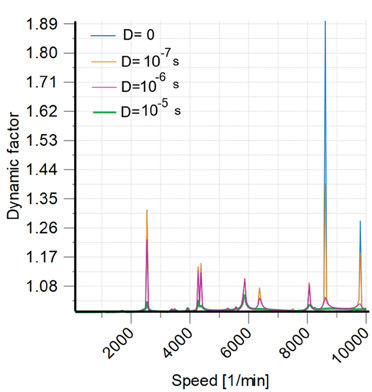
In the first step, the dynamic factor of the gear pairs for different values of the shaft damping is checked. Figure 5 depicts the effect of torsion, axial, and bending damping on the reduction of the maximum dynamic contact force. The damping effect at higher excitation frequencies with D = 10-5 s is more obvious.
Damping in Gear Meshes
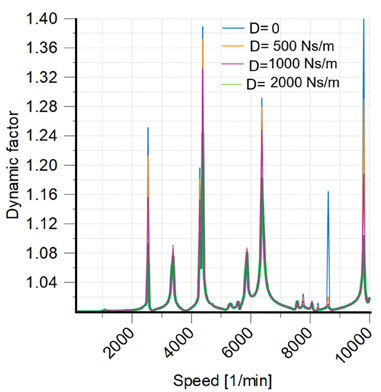
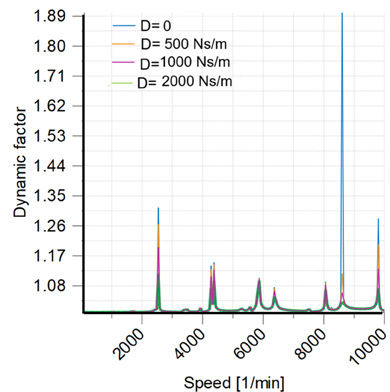
In the next step, the dynamic factor of the gear pairs for different values of the gear mesh damping is examined. According to Figure 6, the influence of the gear mesh damping becomes particularly evident when the excitation frequency coincides with one of the system’s eigenfrequencies related to the gear mesh compliance, rather than the shaft deformations. This can be seen here again at S = 8,543.43 rpm, which is in fact the eigenmode No. 17, see Table 4.
Damping in Bearings
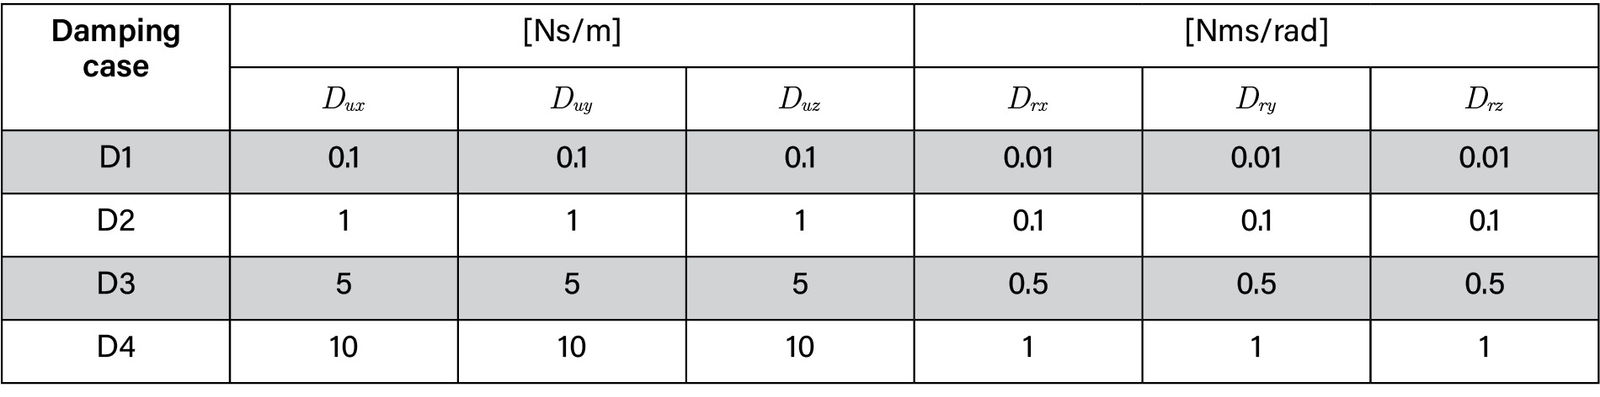
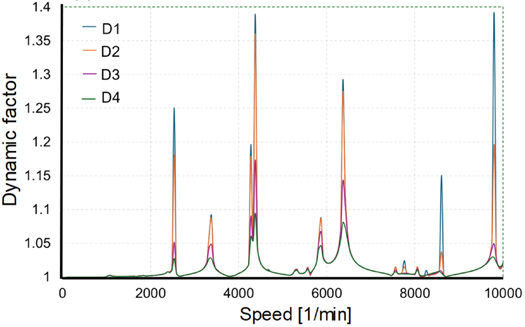
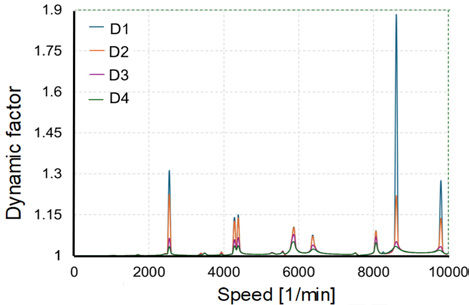
In this section, the effect of damping in bearings is investigated. For this purpose, four different cases, D1 to D4, with their six components of the damping values are considered as given in Table 5. As the result of this comparison, Fig. 7 shows the results. In contrast to the case of gear mesh damping, here the damping effect on the reduction of dynamic factor peaks is evident.
Damping in Different Input Torque Levels
The torque-induced variations in bearing stiffness and gear meshing stiffness significantly influence the system’s modal frequencies and vibration modes. For instance, as torque increases, bearing reaction forces intensify, leading to greater bearing deformation. This results in a relative reduction in bearing misalignment, which can affect the dynamic response of the gearbox. Additionally, gear meshing stiffness plays a pivotal role in determining the system’s natural frequencies and mode shapes. Studies have shown that variations in meshing stiffness can lead to abrupt changes in coupling frequencies and mode shapes, thereby influencing the dynamic behavior of the system.
Section 7 investigates the impact of damping in shafts, bearings, and gear meshes on the reduction of maximum dynamic gear mesh forces, initially assessed at a nominal input torque of 320 Nm. This section extends the analysis by varying the input torque from 40–320 Nm in 40 Nm increments. This incremental approach provides deeper insights into how torque levels influence the damping of undesired vibrations. A critical observation is that the eigenfrequencies of the gearbox model are torque-dependent, influenced by the torque ratio of the gear pairs. Changes in the input torque alter bearing stiffness values, which in turn affect the modal characteristics of the gearbox. Consequently, the peaks of the dynamic factor occur at different excitation frequencies compared to those observed in Figure 4. Therefore, in this section, the same increments in the damping values of the shafts, gear meshes, and bearings, as described in “Effect of Damping,” are considered. The speed range of the input shaft is considered from 100–10,000 rpm at 200 evenly spaced speeds. To assess the effect of input torque variation, a damping measure is introduced here. To calculate this measure, the dynamic factor after applying damping is calculated and subtracted from the associated dynamic factor for the case of undamped case. Therefore, this damping measure is merely the difference between the dynamic factors of the undamped and damped systems. The results are shown in Figures 8–10.
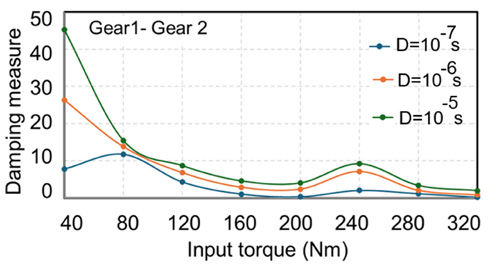
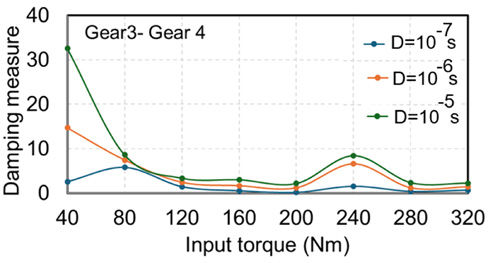
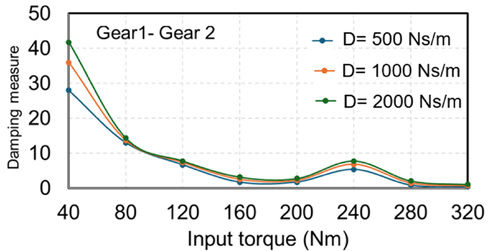
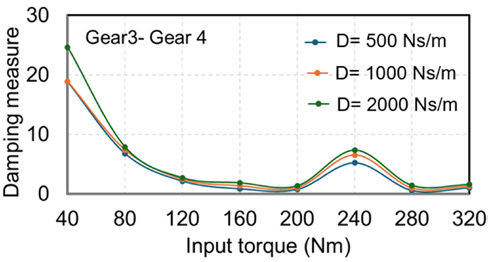
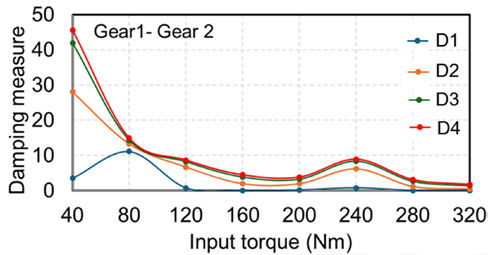
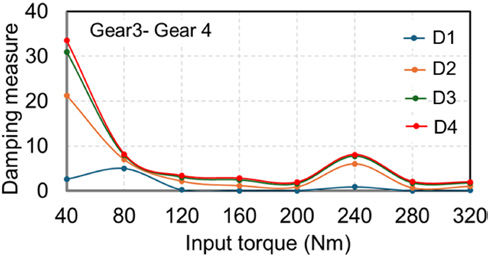
According to Figure 8, at a low input torque of 40 Nm, all three damping levels show a high damping measure, with the highest value observed at D = 10−5 s, indicating a significant reduction in dynamic forces. As the input torque increases, the damping measure rapidly decreases, stabilizing at lower values beyond approximately 120 Nm. This suggests that at higher torques, changes in the dynamic behavior of the gearbox, likely due to increased bearing stiffness and altered modal properties, reduce the overall effectiveness of damping. A slight resurgence in damping effectiveness is observed between 200 Nm and 280 Nm, where the damping measure temporarily increases before declining again at 320 Nm. This reflects the torque-dependent shift in eigenfrequencies, which causes the system to re-enter resonance-prone regions at specific operating conditions. Figure 9 illustrates the damping measure for both gear pairs under varying input torques, considering three levels of gear mesh damping: 500, 1,000, and 2,000 Ns/m. As with previous results, the damping measure quantifies the reduction in dynamic response due to energy loss. At low input torque, 40 Nm, higher mesh damping leads to significantly greater reductions in the dynamic factor, with diminishing returns as torque increases. Beyond 120 Nm, the damping effectiveness plateaus, with all three damping levels converging to similarly low values. A moderate increase in the damping measure occurs between 200–280 Nm, again highlighting the resonance sensitivity due to torque-dependent modal shifts. Finally, Figure 10 shows how varying bearing damping levels (D1–D4) affect the damping measure across increasing input torque. Higher damping values (D2–D4) yield significantly greater dynamic force reduction at low torque (40–80 Nm), while their influence diminishes and converges at higher torque levels. The lowest damping case (D1) remains consistently less effective across all torques.
Combined Damping Effect
Research shows that shaft, gear mesh, and bearing damping interact nonlinearly: an amount of damping that is beneficial in one component can amplify dynamic transmission error or shift critical speeds once the other two sources are active. As a further study, the three damping sources as independent factors are considered to explore their interaction across the whole operating input speed 100–10,000 rpm for the nominal input torque 320 Nm. Initially, the system is evaluated in an undamped state to identify critical speeds where gear meshing excitations induce significant dynamic loads on the bearings. This step is crucial for pinpointing operational speeds that may lead to elevated noise emissions from the gearbox housing due to resonance phenomena. Subsequently, damping is introduced into the model with the following parameters: shaft damping coefficient of 10-5 s, gear mesh damping coefficient of 1,000 Ns/m, and bearing damping as specified in case D3 (refer to Table 5). The dynamic factor of both gear pairs is illustrated in Figure 11. The difference between the dynamic factors in the undamped (Figure 4) and damped (Figure 11) cases reveals the effect of damping with selected coefficients on the reduction of undesired vibrations at speeds that correspond to one of the eigenfrequencies.
The peak-to-peak amplitudes of the bearing reaction forces are illustrated in Figures 12 and 13, respectively. Comparative analysis reveals that incorporating damping significantly attenuates the peak-to-peak amplitudes, indicating a substantial reduction in dynamic loading. However, in the damped configuration, a pronounced peak in bearing reaction forces is observed at approximately 4,280 rpm, identifying this speed as a critical resonance point. To further assess the impact of this critical speed on the NVH characteristics, the corresponding bearing reaction force data at 4,280 rpm are exported to RecurDyn. This data serves as input for subsequent NVH simulations aimed at evaluating and mitigating potential noise emissions from the gearbox housing.
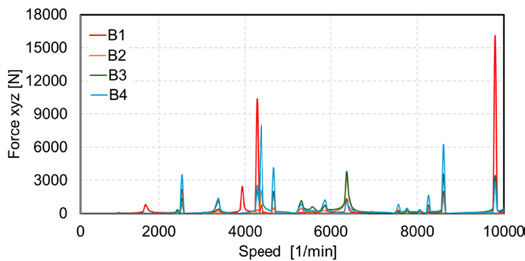
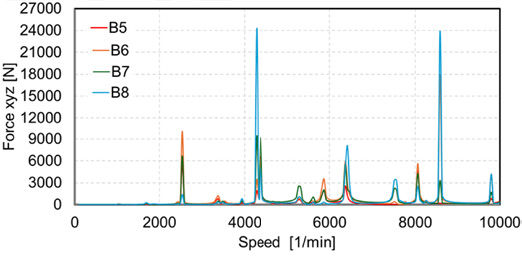
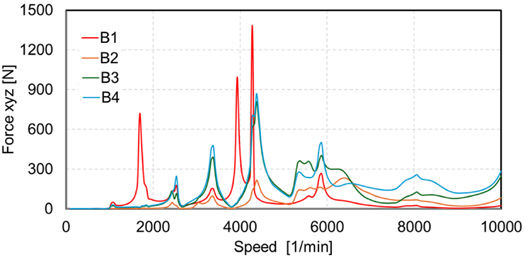
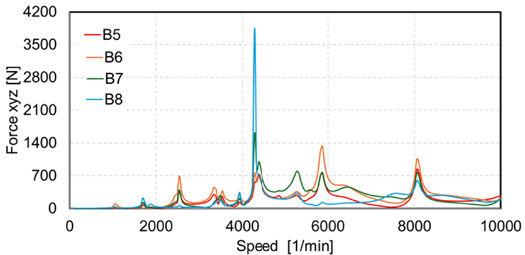
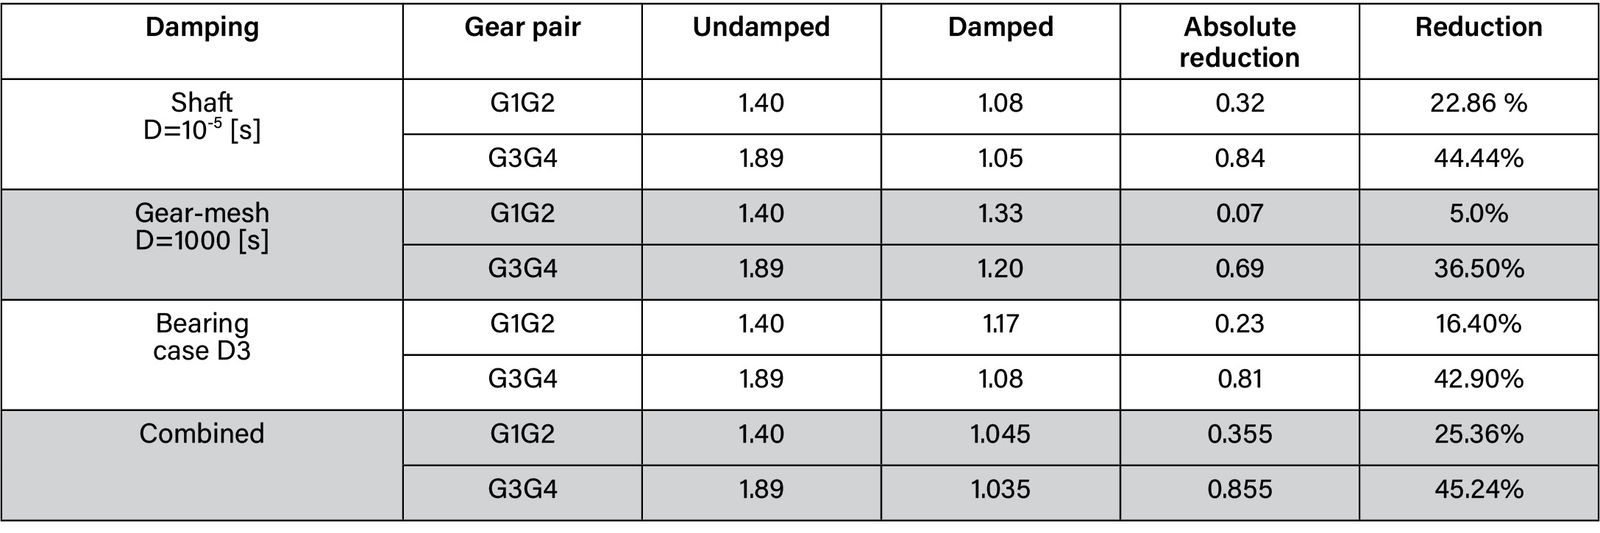
To quantitatively assess the influence of different damping sources on gearbox vibration, the maximum values of the dynamic factor were extracted from the simulation results for the undamped case and for each damping configuration (shaft, gear mesh, bearings, and combined damping). Table 6 provides a compact summary of these peak values for both gear pairs, together with the corresponding absolute and percentage reductions relative to the undamped baseline. This comparison highlights the relative effectiveness of each damping mechanism in reducing dynamic loads.
It can be further concluded from Table 6 that:
Gear3–Gear4 benefits most from damping: all three single-source damping strategies give large reductions (~36–44 percent), and combined damping gives the largest (~45 percent). This indicates the problematic peaks for G3–G4 are strongly dampable (likely mesh-related resonances and bearing-transmitted energy).
Gear1–Gear2 shows moderate reductions:
Shaft damping (22.9 percent) and bearing damping (16.4 percent) perform similarly and significantly.
Gear-mesh damping has less effect on G1–G2 (5.0 percent), implying those peaks are driven less by mesh-compliance resonances and more by shaft/bearing dynamics.
Combined damping produces the best overall result for G1–G2 (25.4 percent), but the extra gain above the best single-source (shaft: 22.9 percent) is modest (~2.5 percent).
These numbers imply that the bearing damping provides a broad and consistent reduction across the entire speed range, making it the most effective single-location damping strategy.
Combined damping yields the largest reductions overall, but the interaction is not strongly synergistic, meaning that the combination gives modest extra reduction beyond the best single damping source (especially for G1–G2).
Beyond the quantitative comparison of peak dynamic factors, it is also important to highlight the qualitative differences in how each damping source influences system dynamics. While all mechanisms contribute to vibration mitigation, their effects differ in magnitude, frequency dependence, and consistency. Table 7 summarizes the typical characteristics of shaft, gear mesh, and bearing damping, as well as their combined action, indicating where each mechanism is most effective and how they interact within the drivetrain system.
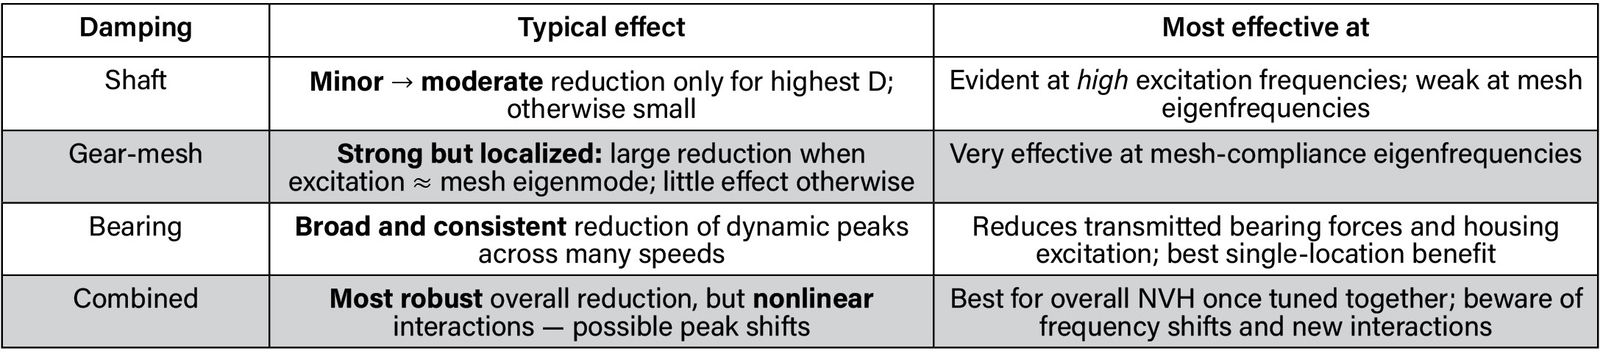
Overall, the results confirm that shaft and bearing damping are the most effective individual mechanisms for mitigating dynamic loads, while the combined damping configuration provides the most significant overall reduction in dynamic factor, ensuring smoother operation across the entire speed range.
NVH analysis in RecurDyn
In the previous section, the forced response analysis of the gearbox model in the undamped and damped conditions was conducted. The analysis yielded the bearing reaction forces data. Subsequently, these bearing forces for both undamped and damped cases (corresponding to the input speed 4,280 rpm) are imported into RecurDyn and applied directly to the powertrain housing at the bearing locations, including the bearings, shafts, and gears from the model. The process commences with configuring the housing parameters and performing a modal analysis to extract a reduced-order flexible model, focusing on the first 200 eigenfrequencies. Time-dependent spline functions representing the bearing forces are then applied at the corresponding housing positions. Before executing the NVH analysis, a dynamic simulation is conducted to determine the housing’s response. A critical kinematic parameter for the NVH assessment (the surface velocities at the nodes of the meshed geometry) is calculated. Finally, the equivalent radiated power (ERP), which quantifies the noise emitted from the housing surface to the environment, is computed as follows:

(3)
Where fRLF is the radiation loss factor, C is sound velocity, ρ is the density of a target material which transfers the noise, e.g., air, Ai is the area on the ith flexible panel of the meshed surface, and vi is its face normal velocity. Further details can be found in Ref. 22. To clearly demonstrate which parts of the housing’s surface emit higher noise, the contour plot of the ERP is very helpful. It can subsequently be used to address the design modifications demanded, such as local stiffening of the housing by means of the ribs, to reduce the noise.
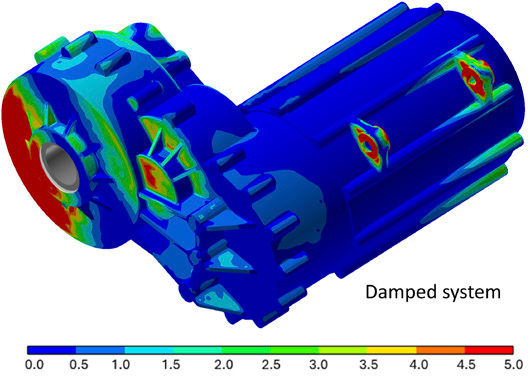
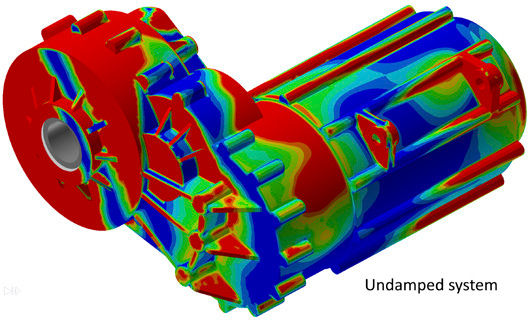
Figure 14 shows ERP contours of both cases. Tmax denotes the time at which the ERP reaches its maximum value. The maximum values of the color legends are adjusted to clearly show the noise distribution through the housing`s surface. It is noticeable to mention that the variation of the ERP depends on the simulation time and on the locally evaluated position on the housing. It is clearly seen that in the undamped model, the region of the housing close to the bearings of the output shaft has higher ERP values and consequently emits noise to the environment. In contrast, the housing of the damped model has a superior performance with respect to the noise emission. The difference between the ERP values of both models reveals this superiority.
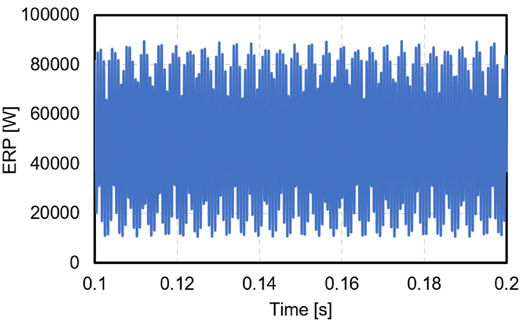
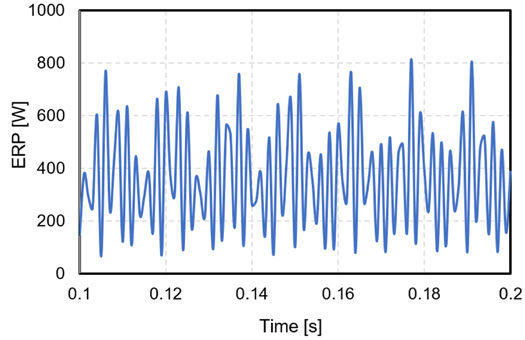
To further clarify the performance of both models, the ERP in time domain is calculated for the surface next to the output shaft by considering the first 20 eigenfrequencies of the housing. The results are plotted in Fig. 15. These results characterize the improvement level of the noise emission from the housing surface based on the damping values selected for this purpose. This in fact implies that proper selection of damping properties leads to a lower level of noise emission by reducing the double amplitudes of the excitation forces and subsequently lower excitations to the powertrain system at critical speeds.
Conclusion
The effect of internal damping of the elements of a drivetrain under various loading conditions was compared. The forced response analysis of the model was carried out to calculate the dynamic behavior of the gearbox model subjected to dynamic loads from different excitation sources. The effect of damping in bearings, shafts, and gear meshes was separately investigated to provide more insight into to their individual effect on the reduction of the meshing contact forces and the bearing reaction forces. Then, the analysis was followed by considering the case when the effect of damping in all elements was combined. The results confirmed that the damping effectiveness is highly sensitive to input torque. While high damping values are most beneficial at lower torque levels, the system’s dynamic response—and hence the benefit from damping—becomes less pronounced as torque increases. Damping is highly effective at low torque levels but becomes less influential as input torque rises. This highlights the need for adaptive damping strategies in gearbox systems that operate under wide torque ranges. The convergence of damping measures across damping levels at higher torques suggests that beyond a certain threshold, increasing gear mesh damping yields minimal additional benefits. This underlines the importance of optimizing damping parameters based on expected operating torque ranges. Future research should focus on developing advanced damping materials and techniques tailored to specific drivetrain configurations to further improve NVH outcomes.
References
Ankouni, M., 2016, “Modeling of Damping in Elastohydrodynamic Lubricated Contacts: Application to Gear Dynamics,” Ph.D. thesis, Université de Lyon.
Amabili, M. and Rivola, A., 1997, “Dynamic Analysis of Spur Gear Pairs: Steady-State Response and Stability of the SDOF Model With Time-Varying Meshing Damping,” Mech. Syst. Signal Process., 11, pp. 375–390.
Liu, S. and Liu, F., 2019, “Vibration Characteristics of Spur Gear System With Non-Linear Damping Under No Lubrication Condition,” J. Vibroeng., 21(5), pp. 1260–1270.
Hortel, M. and Škuderová, A., 2007, “Linear and Nonlinear Damping in Dynamics of Gear Mesh of Parametric Systems With Impacts,” Eng. Mech., 14, pp. 91–104.
Li, S. and Kahraman, A., 2011, “A Spur Gear Mesh Interface Damping Model Based on Elastohydrodynamic Contact Behaviour,” Int. J. Powertrains, 1, pp. 4–21.
Guilbault, R., Lalonde, S., and Thomas, M., 2012, “Nonlinear Damping Calculation in Cylindrical Gear Dynamic Modeling,” J. Sound Vib., 331, pp. 2110–2128.
Liu, F.H., Theodossiades, S., Bergman, L.A., Vakakis, A.F., and McFarland, D.M., 2015, “Analytical Characterization of Damping in Gear Teeth Dynamics Under Hydrodynamic Conditions,” Mech. Mach. Theory, 94, pp. 141–147.
Ankouni, M., Lubrecht, A., and Velex, P., 2016, “Modelling of Damping in Lubricated Line Contacts – Applications to Spur Gear Dynamic Simulations,” Proc. Inst. Mech. Eng., Part C: J. Mech. Eng. Sci., 230, pp. 1222–1232.
Yousfi, N., Zghal, B., Akrout, A., Walha, L., and Haddar, M., 2020, “Selection of Viscous Damping Coefficients Using the Continuous Wavelet Transform Method for a Gear System,” J. Theor. Appl. Mech., Vol. 58, pp. 585–598.
Yousfi, N., Zghal, B., Akrout, A., Walha, L., and Haddar, M., 2022, “Estimation of the Damping Model of a Spur Gear Pair System Including a Time-Varying Loading,” C. R. Méc., Vol. 350, pp. 255–267.
Zhou, J. and Wenlei, S., 2014, “Vibration and Noise Radiation Characteristics of Gear Transmission System,” J. Low Freq. Noise Vib. Active Control, Vol. 33, pp. 485–502.
Bozca, M., 2018, “Transmission Error Model-Based Optimisation of the Geometric Design Parameters of an Automotive Transmission Gearbox to Reduce Gear-Rattle Noise,” Appl. Acoust., Vol. 130, pp. 247–259.
Zubik, M., Prokop, A., Rehak, K., and Novotny, P., 2015, “The Effect of the Gear Parameters to the Noise of Transmission,” Vibroeng. Proc., Vol. 6, pp. 357–362.
O’Rourke, R. and Grander, M., 1999, “Cast Iron: A Solid Choice for Reducing Gear Noise,” Gear Technology, Sept/Oct, pp. 46–49.
Senthilvelan, S. and Gnanamoorthy, R., 2006, “Damping Characteristics of Unreinforced, Glass and Carbon Fiber Reinforced Nylon 6/6 Spur Gears,” Polym. Test., Vol. 25, pp. 56–62.
Sharma, A., Aggarwal, M.L., and Singh, L., 2016, “Experimental Investigation Into the Effect of Noise and Damping Using Composite Spur Gear,” Proc. 5th Int. Conf. on Materials Processing and Characterization (ICMPC), Hyderabad, India, Mater. Today: Proc., Vol. 4, pp. 2777–2782.
Inoue, K., et al., 2020, “Vibroacoustic Simulation of Gearboxes with Coupled Structural-Acoustic Models,” Mech. Syst. Signal Process., Vol. 146, Art. No. 106996.
Zhou, R., et al., 2019, “Effect of Time-Varying Mesh Stiffness and Damping on Gear Noise Prediction,” J. Sound Vib., Vol. 443, pp. 1–14.
Wu, Y., et al., 2021, “Damping Modeling and Noise Behavior of Plastic Gears Under Varying Operational Conditions,” Appl. Acoust., Vol. 179, Art. No. 107901.
Ebrahimi, S., Kissling, U., and Matkovič, S., 2024, “Characterization of the Gear Meshing Damping of Gear Drives With Plastic Gears Using the Forced Response Analysis for NVH Prediction,” Gear Technology, Jan/Feb, pp. 52–55.
KISSsoft AG., 2023, KISSsoft User Manual, KISSsoft AG, Bubikon, Switzerland.
FunctionBay Co. Ltd., 2019, RecurDyn User Manual, FunctionBay, Seoul, South Korea.